Senin, 18 Juli 2011

Fisika dan Kepemimpinan


Seri Kuliah Fisika dan Teknologi untuk Presiden-Presiden di Masa Depan


Kepemimpinan dalam Fisika

(Prof. Yohanes Surya, Ph.D./Rektor Universitas Multimedia Nusantara)


Fisika adalah ilmu tentang alam. Dalam fisika kita belajar bagaimana cara alam bekerja. Dalam Fisika kita juga belajar apa yang menyebabkan segala sesuatu di alam itu terlihat sangat teratur.
Misalnya kita belajar apa yang menyebabkan planet-planet dapat mengorbit matahari secara teratur. Atau apa yang membuat elektron-elektron mengorbit inti atom.

Para fisikawan selama beberapa ratus tahun terakhir ini telah berhasil mengetahui banyak aturan-aturan yang menakjubkan dalam alam semesta ini. Aturan-aturan ini sekarang dinyatakan dalam bentuk hukum-hukum Fisika.

Pada waktu saya mempelajari hukum-hukum Fisika, saya berpikir, jika hukum-hukum ini dapat mengatur gerak alam semesta, apakah mungkin hukum-hukum ini juga dapat digunakan untuk mengatur orang, organisasi, perusahaan, daerah ataupun negara? Apa yang kita dapat manfaatkan hukum Fisika ini dalam kepemimpinan?

Dalam Fisika ada empat fenomena yang menarik perhatian saya yaitu fenomena gerak benda dan penyebabnya (saya namakan ini fenomena Newton), fenomena relativistik (saya namakan ini fenomena Einstein), fenomena kuantum dan fenomena pengaturan diri ketika suatu sistem berada pada kondisi kritis yang saya namakan fenomena mestakung.

Tiap-tiap fenomena ini terjadi pada situasi dan kondisi tertentu yang unik. Sangat menarik untuk mempelajari tiap fenomena ini dan melihat bagaimana hukum-hukum fisika bekerja pada tiap-tiap fenomena.

Fenomena Newton

Pada abad ke 17-18 Newton memperkenalkan tiga hukum yang sangat terkenal tentang gerak benda dan penyebabnya. Hukum pertamamengatakan bahwa suatu benda yang sedang diam akan cenderung untuk tetap diam jika tidak ada yang mengganggunya. Atau suatu benda yang sedang bergerak lurus teratur akan terus bergerak lurus teratur.

Sedangkan hukum kedua mengatakan bahwa benda yang mendapat gaya akan bergerak dipercepat. Makin besar gayanya makin besar pula percepatannya. Dan yang terakhir adalah bahwa ketika benda mendapat gaya (aksi) benda akan memberikan gaya reaksi yang besarnya sama dengan gaya aksi tersebut.

Ketiga hukum Newton ini bekerja dengan baik pada suatu sistem inersial (suatu sistem yang tenang, sistem yang tidak dipercepat, tidak dalam keadaan chaos).

Dalam kepemimpinan, hukum Newton ini dapat diterapkan pada kondisi organisasi (perusahaan, daerah, negara) yang tenang atau dibuat tenang. Dalam kondisi tenang ini, orang cenderung malas.

Mereka malas bergerak, mereka maunya diam saja (hukum I Newton). Pemimpin yang dibutuhkan disini adalah pemimpin yang mempunyai visi yang jelas dan terukur serta mempunyai daya dobrak. Visi dapat menjadi suatu faktor pendorong untuk mempercepat kemajuan organisasi ini. Dengan daya dobrak yang dimiliki, pemimpin ini akan mampu menghadapi kelembaman (kemalasan) dari orang-orang yang dipimpinnya dan mampu memberikan stimulir-stimulir untuk orang- orang di organisasi tersebut terus bergerak.

Pemimpin jenis ini membutuhkan sumber daya (resources) baik berupa SDM (sumber daya manusia) ataupun SDA (sumber daya alam) yang kuat agar ia mempunyai energi yang cukup untuk terus memberikan gaya penggerak.

Contoh kepemimpinan model ini adalah Indonesia dalam masa orde baru. Awalnya Suharto berusaha membuat negara tenang secara militer. Kemudian ia memperkenalkan visi yang terukur dalam bentuk repelita (rencana pembangunan lima tahun). Ia terus memberikan stimulir-stimulir hingga roda perekonomian terus bergerak dan makin lama makin cepat. Keberhasilan Suharto karena ia juga ditopang oleh SDA Indonesia yang luar biasa.

China juga melakukan hal yang serupa, saat ini dalam situasi yang tenang, China mempercepat pembangunan dengan memberikan stimulir-stimulir bagi para investor. Ia juga memanggil para ilmuwan yang berada di luar negeri untuk pulang kampung menjadi gaya-gaya penggerak perekonomian. Keberhasilan China ini karena mereka mempunyai SDM yang sangat bagus.

Hal esensial lain dalam kepemimpinan model Newton ini adalah diperlukannya sifat otoriter dan tegas dari sang pemimpin. Pemimpin harus tegas untuk menjamin organisasi yang dipimpinnya tetap tenang dan aman. Tidak boleh ada oposisi. Mereka yang berusaha menimbulkan goncangan harus segera diredam.


Lecture by:

Richard A. Muller (born January 6, 1944 in New York, New York, USA) is a physicist who works at the University of California, Berkeley and Lawrence Berkeley National Laboratory.

Career

Muller obtained a A.B. degree at Columbia University (New York) and a Ph.D. degree in physics from University of California, Berkeley. Muller began his career as a graduate student under Nobel laureate Luis Alvarez doing particle physics experiments and working with bubble chambers. During his early years he also helped to cocreate accelerator mass spectroscopy and made some of the first measurements of anisotropy in the cosmic microwave background.

Subsequently, Muller branched out into other areas of science, and in particular the Earth sciences. His work has included attempting to understand the ice ages, dynamics at the core-mantle boundary, patterns of extinction and biodiversity through time, and the processes associated with impact cratering. One of his most well known proposals is the Nemesis hypothesis suggesting that the sun could have an as yet undetected companion dwarf star, whose perturbations of the Oort cloud and subsequent effects on the flux of comets entering the inner solar system could explain an apparent 26 million year periodicity in extinction events.


I am a Professor in the Department of Physics at the University of California at Berkeley, and Faculty Senior Scientist at the Lawrence Berkeley Laboratory, where I am also associated with the Institute for Nuclear and Particle Astrophysics. Don't confuse me with Richard S. Muller.
This is me.
For a more interesting photo, click on the image. For a high-res jpeg of the photo on the left, click here.

Muller's vita is available in html or pdf
You can also jump to current research.


My new book, The Instant Physicist, is now available for $11 to $13 at Amazon, Barnes & Noble, Borders, Powell's, and Indiebound. Amazon and B&N show sample pages including the great art of Joey Manfre. Listen to my interviews about the book on KQED FM: Forum and on CBS radio. Humor and Physics do mix!

Global Warming. We have begun a new major research project to make an independent evalution of global warming through a careful analysis of the most complete set ever used of land surface temperature measurements. For details, see BerkeleyEarth.org.

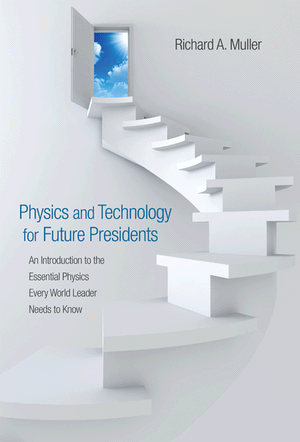
See Physics for Future Presidents web page about the course I teach. Princeton University Press has now published the full color, glossy, yet cheap ($44.35 on Amazon) textbook Physics and Technology for Future Presidents.

Interested in 3D TV without glasses? See the link to my new company, SolidDD.com

See my movie of the Finale of the Paul McCartney Concert (10 July 2010).

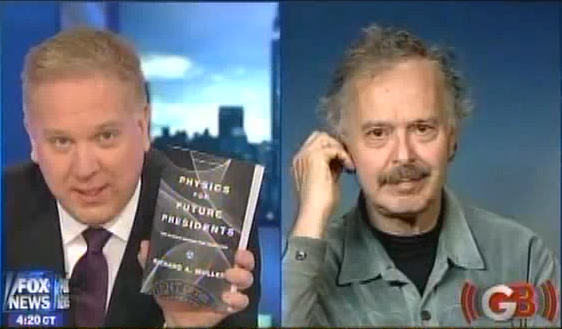
See Rich on the Glen Beck show, discussing the Iranian nuclear threat. The discussion took place Friday 5 Feb 2010. Beck says: "I have read your book. It is fantastic. Everybody should read this book if you are interested in science at all and you're interested in the future." But he doesn't like the part on Global Warming.

Naked Copenhagen my Op-Ed piece has now appeared in the Wall St. Journal. For details of the calculations, go to MullerandAssociates.com.

See my presentation at the WNET Celebration of Teaching and Learning

See a photo of Barack Obama reading my popular book! -- while in bed -- and being so distracted that he ignores the ringing red phone -- while Michelle looks on with concern. Well, OK, maybe it isn't a photo. It was done by Victor Juhasz. See the image here.

Cycles in Fossil Diversity. Our discovery of the 62 Myr cycle was published in 2005, but now we present the data parsed in 171 different ways! See below.

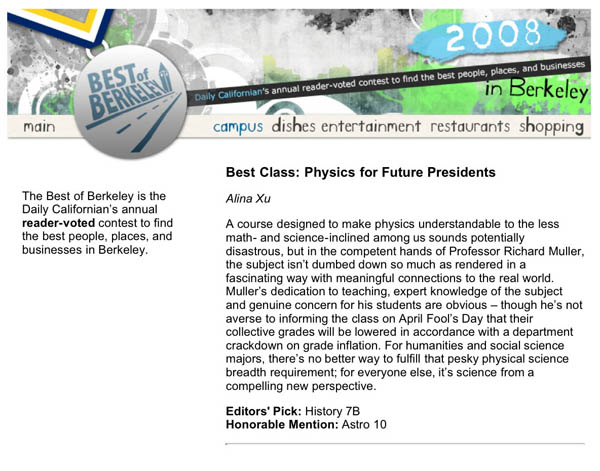
My course, Physics for future Presidents, has just been given the highest award it could possibly earn: in a poll taken by the student newspaper, The Daily Californian, it was named Best Class at Berkeley! (It has won this honor for the last two years in a row.)


Popular Version

There are two books I have written with similar titles. Physics for Future Presidents is written for popular readers -- meant to be read rather than studied, is shown on the left. I've been on NPR twice answering call-ins: listen to Michael Krasny on Forum or Tom Ashbrook's "On Point". It is now available in paperback (cheap).

The more detailed book, a textbook for my course, is on the right side. The popular version has five sections: terrorism, energy, nukes, space, and global warming. The new Princeton University Press text has 13 chapters including a new one on climate change, multiple choice and essay questions, and is suitable for a course, Interested in teaching from it? Here is a link: Physics and Technology for Future Presidents. We've kept the price under $50.

Class Textbook

Muller teaches physics to Hillary Clinton, Barack Obama, John McCain, and other candidates (photo taken by Joey Manfre).

Science Magazine piece about UC Berkeley's success in broadcasting my lectures on YouTube.

A soldier in Iraq listened to my physics lectures while manning a .50-caliber machine-gun and watching over a goat herder's field where insurgents were suspected of passing through a week earlier. Read the whole story.

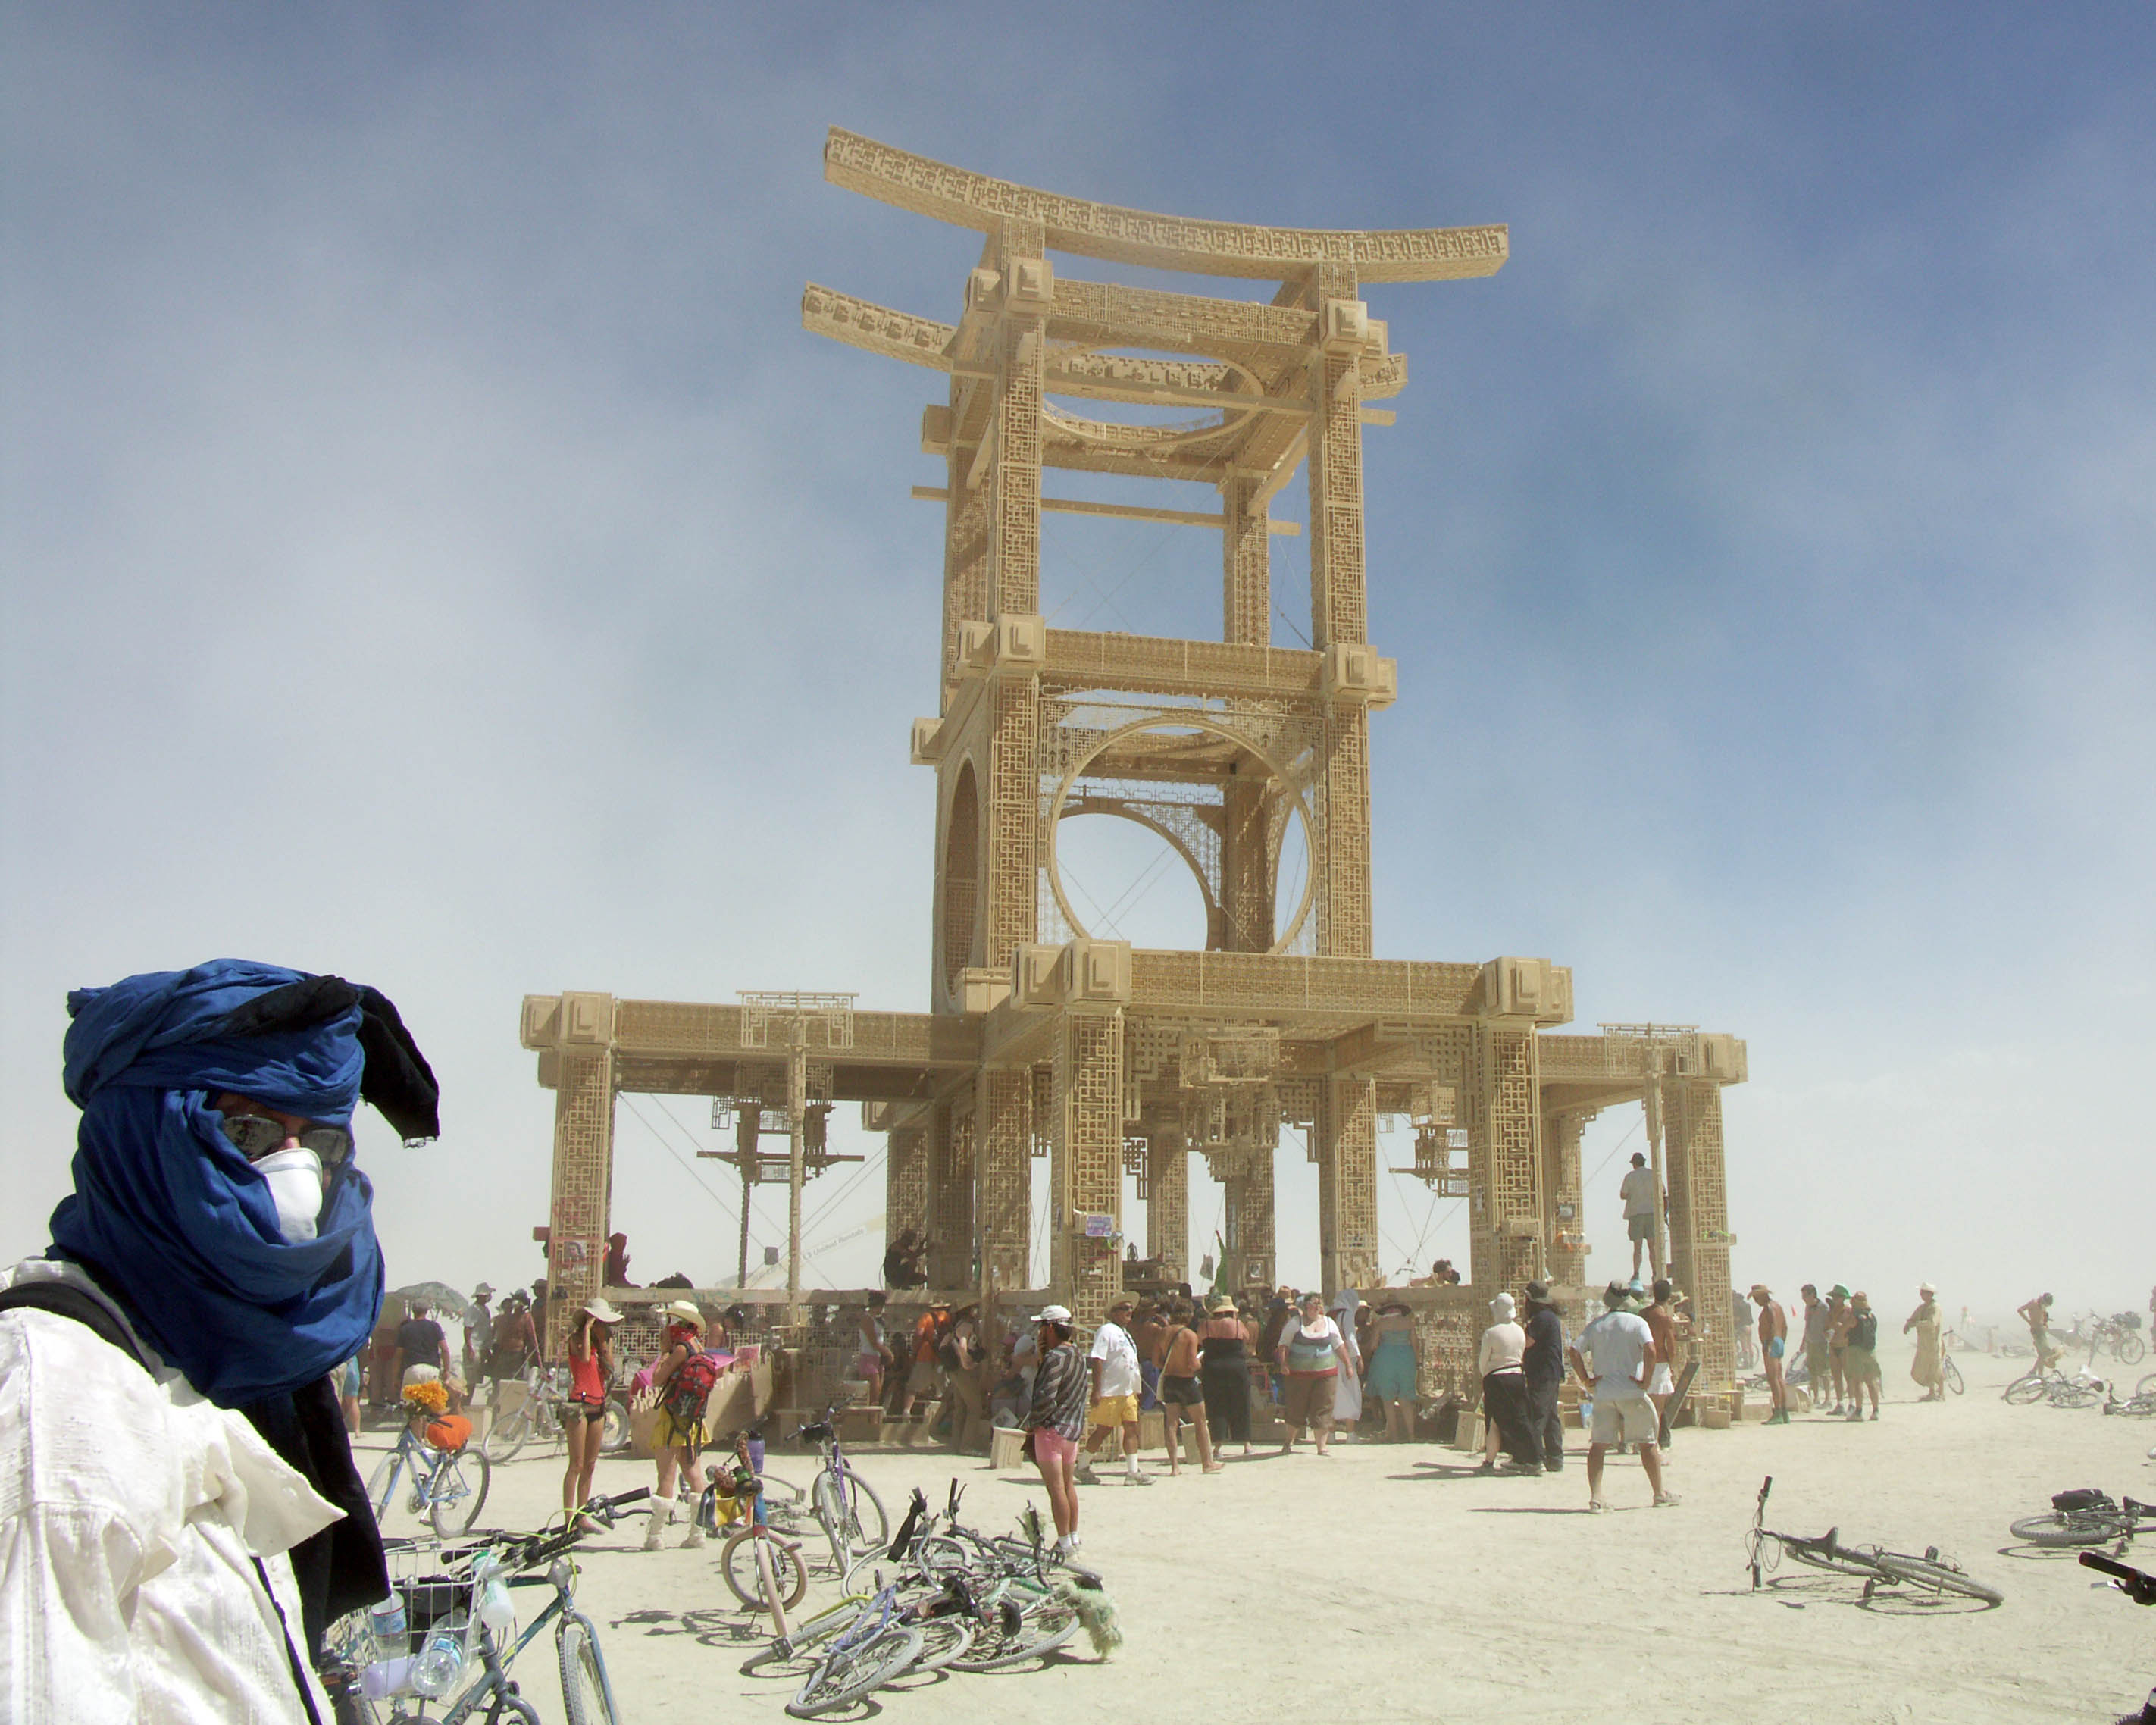
Burning Man 2007. See my movies and photos. Most impressive is the Movie of the Burning Man. taken September 2, 2007. My favorite art was the Big Round Cubatron. See my movie of it, and also artist Mark Lottor's website. Night Panorama of Black Rock City gives a sense of the place. Also the Fire Wheel Movie. Burning Man Photos give the overall picture, including a photo of me in full Tuareg dress, standing by the Temple. (The Tuareg figured out years ago how to protect themselves from sandstorms, and the protection really does work. I added the face mask.)

Watch the TV clip about my class Physics for future Presidents that was on ABC7 News on May 21, 2007. Go to: Top Universities Offer Free Lectures Online.

Muller's Theorems. The complete list is now posted.

Photos from our August 2007 backpack trip to Hoover Wilderness and the Virginia Canyon in Yosemite.

Historic FSM photos inside Sproul Hall, Dec 3-4, 1964. For the first time, I have posted the photographs I took during the Free Speech Movement Sproul Hall sit in. These include images of Mario Savio, Jack Weinberg, and Joan Baez in the corridors of Sproul. They also show the police charging up the stairs to take control of the window on the second floor, a window that was being used to take food and information in from outside sympathizers. I was arrested, and spent the next night in the Oakland jail. When I was released, to my amazement, the police returned the film to me. I was the only student arrested who later became a professor at Cal.

Nobel Prize. Congratulations to John Mather and George Smoot for the Nobel Prize in Physics, awarded for their work on COBE. I've posted a new pre-COBE history page that includes historically interesting documents that are relevant to the genesis of COBE. These date from the days when I was the Principal Investigator on the U-2 project that discovered the cosine anisotropy of the cosmic microwave background radiation.

Physics for future Presidents, my course (see below) has a textbook, available from Thomson Publishing. It is also available on Amazon, for a higher price, but you might need to make sure you get the right edition. The newer version says "Spring 2008 edition" on the cover.

Wildlife photos from our recent trip to Kenya and Rwanda.
And photos from Carlsbad Caverns, Cuba, Iguacu, the Sierra Nevada, Morocco, Paraguay, Peru, more....

See my little silly essay Dumbledore isn't gay. Not that there's anything wrong with that....


Current Research

Cycles in Fossil Diversity (paper from Nature). See also diversity data parsed in 171 different ways (pdf file). In the 10 March 2005 issue of Nature, graduate student Robert Rohde and I report the discovery of a strong 62 Myr cycle in fossil diversity. (Click for pdf copy.) The cycle is huge, and it does not have a ready explanation. I show below a plot from our paper that shows the number of shorter-duration genera back to 545 Million years ago. (Incidentally, I was misquoted in a newspaper account. No, I have not abandoned the Nemesis idea.) PBS broadcast an interview with me on the subject, but the link is broken; if anybody finds it, please let me know and I'll post the link here. The old (now dead) link was

http://131.243.129.75:554/ramgen/Teid/TABL/Mar-18-2005-CBC-Muller.rm
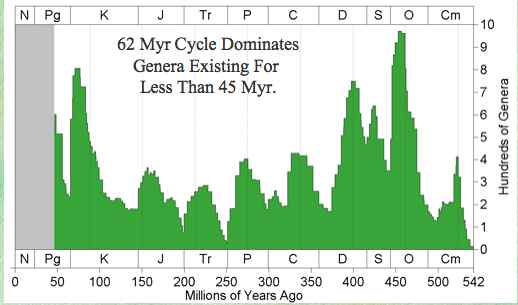
Click the following link to download a pdf file that shows the diversity data parsed in 171 different ways. If you are familiar with paleontology, then these data may give you the clue that you need to figure out what is causing the cycle.

Avalanches at the Core-Mantle Boundary, has been published in Geophysical Research Letters, vol.29, pg 41-1 to 41-4 (12 Oct 2002). Such avalanches may affect geomagnetic reversals and flood basalts. They can be spontaneous, or triggered by oblique impacts of comets and asteroids.

Impacts on the moon (and the earth) increased about 400 Myr ago, a result that we published in SCIENCE in May, 2000. A follow-up investigation on impacts at the Apollo 12 site published in the Journal of Geophysical Research showed a weaker effect than we first reported. This increase, if real, may have implications both for evolution and our model of the solar system. There is an interesting interpretation of these data in terms of the Nemesis idea: see my paper "Measurements of lunar impacts ... and implications for the Nemesis theory." For more on the Nemesis idea, see the next entry:

Nemesis. This is a theory worked out with Marc Davis and Piet Hut. It predicts the future discovery of a small (probably red dwarf) star orbiting the Sun at a distance of a few light years. The theory has been considered controversial and speculative, but it has not yet been ruled out. We should know for sure in the next few years. I wrote an article about our work for the New York Times Magazine in 1985; here is a transcript: NYTimes Article. See the Nemesis web page. See also "Measurements of lunar impacts ... and implications for the Nemesis theory."

We have measured the accretion of extraterrestrial dust by using iridium measurements on Greenland ice. The results are controversial: we found a lower level of accretion than had generally been believed. Read our article.pdf published in Geochimica et Cosmochimica Acta.

A New Theory of Glacial cycles. Also see the article Glacial Cycles and Astronomical Forcing, published in Science vol 277, pp 215-218 (11 July 1997). Also look at our book:
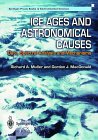
Ice Ages and Astronomical Causes (with coauthor Gordon MacDonald) published by Springer-Praxis in 2000. Click to read the Table of Contents, the Preface or Chapter 1, which contains brief introductions to the History of Climate, Ice Age Theories, and Spectra. It is meant for students or researchers who want to learn how to do spectral analysis of paleoclimate data.It can be ordered from Amazon.com, from Springer New York, Springer Germany, and from Amazon in the UK. . For see the wonderful movie illustrating the changing orbits. I've posted a table of the Earth's orbital inclination for the last 3 Myr.

See the new compilation of ice age data we call the Benthic Stack, published in Paleoceanography (vol 17, 2002). It was tuned to obliquity alone, and represents a new view of climate for the last 860 kyr.


Teaching: Physics for future Presidents

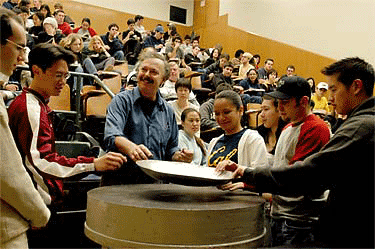
Physics for future Presidents is my name for Physics 10, cross listed as L&S C70V, is the course I currently teach. In one semester, my goal is to cover the physics that future world leaders need to know (and maybe present world leaders too). Go to the PffP home page to read selections from my textbook. It can be purchased at a discount. from Thomson Publishing. And read the article in the San Francisco Chronicle.

(photo by Peg Skorpinski)


My MIT Technology Review Essays

For three years I wrote a monthly column in MIT's Technology Review online. It is based on my class, see above. The essays, in reverse chronological order, are:

The Physics of Gluttony (Nov '04). You lose weight (carbon) only by breathing.
Global Warming Bombshell (Oct '04). Global warming poster child discredited.
Death of the Dinosaurs (Aug '04). There's a lot more we don't know now.
Military Lessons from Iraq War II (July '04). Some may surprise you.
Dirty Bombs (June '04). My greatest fear is fear itself.
Less Lethal Weapons (May '04). Are they good or bad?
Alaska is melting. Can Kyoto save it? (April '04). Climate is local too.
The Witch of Yucca Mountain (March '04). Research won't reassure.
Our Non-expedition to Mars (Feb '04). Mars in 26 years? Only after robots.
The Voice of Osama (Jan '04). Why I think it isn't his.
Medieval Global Warming (Dec '03). Medieval climate becomes politicized.
The Physics Diet (Nov '03). Exercise doesn't work. Eating less does.
Bizarre Math of Elections (Oct '03). Low voter turnout may be a healthy sign.
Cuba Low-Tech (Sept '03). Observations from my visit to Cuba.
When Lie Detectors Lie - or Don't (August '03) They do have valid uses.
Hydrogen Economy Pollution (July '03) Not as clean as you might think.
Deceiving Saddam (June '03) To fool someone, you may have to fool all.
The Weapons Paradox (May '03). Are kinder, gentler weapons, always evil?
Shock and Awe in Babylon (April '03) Early surprises in Gulf War II.
Baghdad Express (March '03) A weapon of mass transport?
Space Shuttle Science (Feb '03) Is it safe? Is it science?
Iraq inspections -- just as expected. (Jan '03) They won't find WMD
North Korea -- the next Iraq? (Dec '02) Yes and no
War with Iraq -- As Predictable as Chess (Nov '02) You'll be surprised
The Lowest-Tech Atom Bomb (Oct '02) Saddam's easiest approach
Did Everything Change? (Sept '02) Why Al Qaeda failed

Airport Insecurity. (Aug '02) The real threat is checked luggage
Who's afraid of 1984? (July '02) Orwell got it backwards
The Conservation Bomb. (June '02) Can counter the population bomb
Weapons of Precise Destruction. (May '02) Predator assassination
Al Qaeda's Anthrax (April '02) See agreement from David Tell
Crop duster terrorism (March '02) Weapons from the corner station

Springtime, Taxes, and the Attack on Iraq (Feb '02) War is inevitable
I've been analyzing the terrorist threat ever since 9-11-01. Read my early articles and judge for yourself how accurate I was (or wasn't):
Analysis of the Terrorist Attack, posted Sept 16 2001, 5 days after 9-11.
The War on Terrorism posted Sept 21, 2001, with my predictions.
The terrorist threat is over, for now posted Oct 26, 2001.
I have put online my viewgraphs for my talk,
Physics of Terrorism, Counterterrorism, and the Conflict with Iraq.


Publications and books

A somewhat out of date list of my publications is available. My vita is available in html or pdf. In addition, I have written five books:

  • Nemesis (Weidenfeld & Nicolson, 1988). Read Chapter 1: Cosmic Terrorist. Copies of the book are available used on Amazon.
  • The Sins of Jesus, a historical novel. You may download selected chapters from this novel for free. Click here for more information.
  • The Three Big Bangs (with coauthor Phil Dauber, Addison/Wesley 1996). Read Chapter 1.
  • Ice Ages and Astronomical Causes: data, spectral analysis, and mechanisms (with coauthor Gordon MacDonald). For sample chapters, see the note posted above.
  • Physics for future Presidents, is now available from Thomson Publishing. You can purchase it at the discount price of $48.87 including shipping (instead of the list price of $57.29) if you enter the promo code ICHP0614 at the site checkout. It is also available on Amazon, for a higher price.


Awards

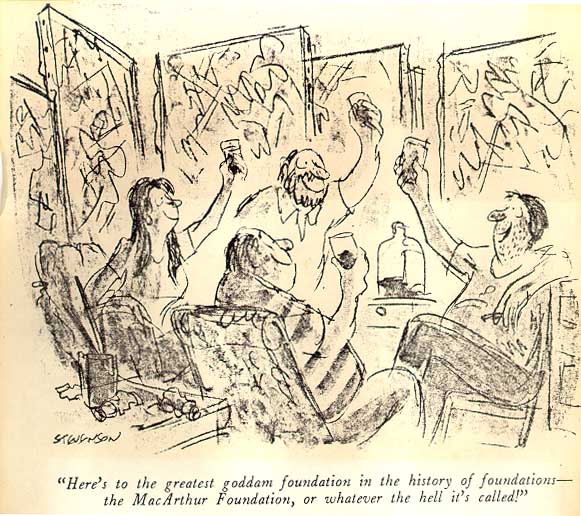
Fellow of the American Academy of Arts and Sciences. (That's special; there are only 218 other physicists.) Teaching awards include the 1999 Distinguished Teaching Award of the University of California (for teaching physics majors), the 2009 Noyce Prize, and the 2010 Phi Beta Kappa Excellence in Teaching Award for Northern California. My other awards include the Mac Arthur Prize (1982), the NSF Alan T. Waterman Award, and the Texas Instruments Foundation Founders Prize. A complete list is here. My class Physics for Future Presidents was voted "Best Class on Campus" in 2008 and 2009. My feeling about the MacArthur Award is best expressed by a cartoon from the New Yorker.


Semoga Bermanfaat dan Terima Kasih

Fisika untuk Universitas

Fisika untuk Universitas

Ditujukan untuk meningkatkan kualitas proses dan hasil perkuliahan Fisika di tingkat Universitas


» Download this transcript (PDF)

Today I'd like to talk with you about my early days at MIT and the research that I did here.

This is a long time ago.

I got my Ph.D. in the Netherlands, in nuclear physics, and I came to MIT in January 1966, almost 34 years ago.

And the idea was that I was only going to spend here one year on a postdoc position, but I liked it so much that I never left, and I don't regret it.

I joined the X-ray Astronomy group here of Professor Rossi.

Now, X-ray astronomy has to be done from above the Earth atmosphere or at least near the top of the Earth atmosphere because the X rays are absorbed by air, unlike optical astronomy and radio astronomy, which can be done from the ground.

The kind of X rays that we measure are not unlike those that your dentist is using when he takes an X-ray picture.

The energy range of these X rays is somewhere between one and 30, 40 kilo-electron volts, and if you don't know what a kilo-electron volt is, that's fine, too, but you never express the energy of an X ray in terms of joules, because the number becomes so ridiculously small.

During World War II, under Hitler's Germany, Wernher von Braun developed the V-2 rockets for destructive war purposes.

It was developed in Peenemuende.

And after the war, the Americans used these V-2 rockets for scientific purposes, and the first rocket flights to search for X rays from the Sun took place in 1948.

And X rays were found from the Sun.

That was quite a surprise.

And the power, energy per second that the Sun puts out in X rays divided by the power in optical, which is almost all the radiation of the Sun--

I'll give it the symbol of the Sun--

is approximately 10 to the minus 7, so only one ten-millionth of all the energy comes out in X rays.

So, from an energy point of view, it's very, very little.

It varies a great deal, too.

But it is really very little.

In 1962, scientists here in Cambridge, among them Professor Bruno Rossi, who was a professor at MIT, and Riccardo Giacconi and Herb Gursky--

who were working across the street at American Science and Engineering--

attempted to do an experiment to see whether they could detect X rays from objects outside our solar system.

Now, the odds were very low that they were going to succeed, and the reason is very simple.

If you take the Sun and you move it out to the nearest stars, which is typically ten to a hundred light-years, you wouldn't stand a chance to see X rays.

In fact, the sensitivity of the detectors in these days was too low by at least nine orders of magnitude, a factor of one billion.

To everyone's surprise--

to everyone's, yeah, happy surprise, I should say--

they succeeded, and they discovered an object which was later called Sco X-1.

It's in the constellation Scorpius, "X" stands for X rays, and "1" for the first X-ray source in that constellation.

The total power output of that source was about 10,000 times more than the Sun.

That doesn't make the source so special, because there are many stars in the sky that radiate way more energy than our Sun does, but what's so very special about Sco X-1, that the X-ray power over the optical power for Sco X-1 was approximately 1,000.

In other words, the X rays are the dominant source of energy and the optical is sort of, let's call it a by-product, whereas with the Sun, the optical is the main thing and the X rays is sort of a by-product.

And so the $64 question in those days was, what can these objects be? They must be very different from the Sun, and that's what I want to discuss with you.

When I came to MIT in 1966, there were about six of these X-ray sources known in the sky.

Today there are thousands known, but there were six then.

And they were discovered from rocket flights.

These rockets would be launched, typically from White Sands, and they would spend about five minutes above the Earth atmosphere.

And during those five minutes they scanned the sky, and six sources were discovered.

I joined here the group of Professor George Clark, who is still a professor at MIT.

He was working on observations to be made from very high-flying balloons.

So we would build a telescope, and we would launch it on a balloon, and go near the top of the Earth atmosphere.

It's not as good as a rocket flight which gets completely out of the Earth atmosphere, but the flights on balloons can last way longer than five-minute rocket flights.

We could fly hours and, if we were lucky, even days, but the price we paid for that is that even though there was only very little atmosphere left above us--

about 0.3 percent of the atmosphere was left--

still that caused an effect of the absorption, so we did lose X rays that the rocket flights did not lose.

But we had the great advantage of many, many hours.

To give you a rough idea of what it took in those days--

I worked on this with graduate students and with many undergraduate students--

a telescope in those days, to build it cost typically a million dollars, and it would take us two years to build one.

The balloons that we needed to launch them were about $100,000 in those days, and the helium that we needed to get it up was about $80,000, and the weight of such a payload, of our telescope, was about 1,000 kilograms.

These balloons would go up to 140,000 feet and they were huge--

they were about 500 feet across.

I will show you pictures of them very shortly.

It was a risky business in that no guarantee of success.

You bought the balloons.

If they worked, so much the better.

If they didn't work, tough luck.

There was just no way that you could recover the money.

They were very thin; the balloons are made of polyethylene, and the thickness of the polyethylene was thinner than cigarette paper, so you can imagine how easy it is to damage them, and if you don't damage them during the launch, it's easy to damage them on the way up, due to the jet stream and the very cold layers of air that you have in the tropopause.

So I would like to show you now some slides, and then we will get back to talking a little bit more about X-ray astronomy.

All right, so let's see what we have first.

You see here two of my undergraduate students.

At the time they were undergraduate students.

Now they are both Ph.D.s, and some of you may think that science doesn't have much romance, but there is a lot.

They married and they have kids.


Pengembangan Perkuliahan

1. Buatlah sebuah Esai mengenai materi perkuliahan ini

2. Buatlah sebuah kelompok berjumlah 5 orang untuk menganalisis materi perkuliahan ini

3. Lakukan Penelitian Sederhana dengan kelompok tersebut

4. Hasilkan sebuah produk yang dapat digunakan oleh masyarakat

5. Kembangkan produk tersebut dengan senantiasa meningkatkan kualitasnya


Ucapan Terima Kasih Kepada:

1. Para Dosen MIT di Departemen Fisika

a. Prof. Walter Lewin, Ph.D.

b. Prof. Bernd Surrow, Ph.D.

2. Para Dosen Pendidikan Fisika, FPMIPA, Universitas Pendidikan Indonesia.

Terima Kasih Semoga Bermanfaat dan mohon Maaf apabila ada kesalahan.

Jumat, 15 Juli 2011

Fisika untuk Universitas

Fisika untuk Universitas

Ditujukan untuk meningkatkan kualitas proses dan hasil perkuliahan Fisika di tingkat Universitas

Kelistrikan dan Kemagnetan


Topics covered:
Doppler Effect
The Big Bang
Cosmology
Instructor/speaker: Prof. Walter Lewin

Free Downloads

Video

  • iTunes U (MP4 - 103MB)
  • Internet Archive (MP4 - 203MB)» Download this transcript (PDF)
    Today I want to talk with you about Doppler effect, and I will start with the Doppler effect of sound which many of you perhaps remember from your high school physics.
    If a source of sound moves towards you or if you move towards a source of sound, you hear an increase in the pitch.
    And if you move away from each other you hear a decrease of a pitch.
    Let this be the transmitter of sounds and this is the receiver of sound, it could be you, your ears.
    And suppose this is the velocity of the transmitter and this is the velocity of the receiver.
    And V should be larger than 0 if the velocity is in the direction.
    And in the equations what follow, smaller than zero it is in this direction.
    The frequency that the receiver will experience, will hear if you like that word, that frequency I call F prime.
    And F is the frequency as it is transmitted by the transmitter.
    And that F prime is F times the speed of sound minus V receiver divided by the speed of sound minus V of the transmitter.
    So this is known as the Doppler shift equation.
    If you have volume one of Giancoli you can look it up there as well.
    Suppose you are not moving at all.
    You are sitting still.
    So V receiver is 0.
    But I move towards you with 1 meter per second.
    If I move towards you then F prime will be larger than F.
    If I move away from you with 1 meter per second then F prime will be smaller than F.
    The speed of sound is 340 meters per second.
    So if F, which is the frequency that I will produce, is 4000 hertz, then if I move to you with 1 meter per second, which I'm going to try to do, then the frequency that you will experience is about 4012 hertz.
    It's up by 0.3 percent.
    Which is that ratio one divided by 340.
    And if I move away from you with 1 meter per second, then the frequency that you will hear is about 12 hertz lower.
    So you hear a lower pitch.
    About 0.3 percent lower.
    I have here a tuning fork.
    Tuning fork is 4000 hertz.
    I will bang it and I will try to move my hand towards you one meter per second roughly.
    That's what I calculated it roughly is.
    Move it away from you, towards you, away from you, as long as the sound lasts.
    You will hear the pitch change from 4012 to 3988.
    Very noticeable.
    Have you heard it?
    Who has heard clearly the Doppler shift, raise your hands, please?
    OK.
    Chee chee chee chee it's very clear.
    Increased fre- frequency and then when I move my hands, away a lower pitch.
    Now you may think that it makes no difference whether I move towards you or whether you move towards me.
    And that is indeed true if the speeds are very small compared to the speed of sound.
    But it is not true anymore when we approach the speed of sound.
    As an example, if you move away from me with the speed of sound, you will never hear me.
    Because the sound will never catch up with you, and so F prime is 0.
    And you can indeed confirm that with this equation.
    But if I moved away from you with the speed of sound, for sure the sound will reach with you.
    And the frequency that you will hear is only half of the one that I produce.
    So there's a huge asymmetry.
    Big difference whether I move or whether you move.
    So I now want to turn towards electromagnetic radiation.
    There is also a Doppler shift in electromagnetic radiation.
    If you see a traffic light red and you approach it with high enough speed you will experience a higher frequency and then you will see the wavelengths shorter than red and you may even think it's green.
    You may even go through that traffic light.
    To calculate the proper relation between F prime and F requires special relativity.
    And so I will give you the final result.
    F prime is the one that you receive.
    F is the one that is emitted by the transmitter.
    And we get here then 1 - beta divided by 1 + beta to the power one-half.
    And beta is V over C, C being the speed of light, and V being the s- speed, the relative speed between the transmitter and you.
    If beta is larger than 0, you are receding from each other in this equation.
    If beta is smaller than 0, you are approaching each other.
    You may wonder why we don't make a distinction now between the transmitter on the one hand, the velocity, and the receiver on the other hand.
    There's only one beta.
    Well, that is typical for special relativity.
    What counts is only relative motion.
    There is no such thing as absolute motion.
    The question are you moving relative to me or I relative to you is an illegal question in special relativity.
    What counts is only relative motion.
    If we are in vacuum, then lambda = C / F and so lambda prime = C / F prime.
    Lambda prime is now the wavelength that you receive and lambda is the wavelength that was emitted by the -- by the source.
    So I can substitute in here, in this F, C / lambda which is more commonly done.
    So this Doppler shift equation for electromagnetic radiation is more common given in terms of lambda.
    But of course the two are identical.
    And then you get now 1+ beta upstairs divided by 1- beta to the power one-half.
    The velocity, there if I'm completely honest with you, is the radial velocity.
    If you are here and here is the source of emission and if the relative velocity between the two of you were this, then it is this component, this angle is theta, this component which is V cosine theta, which we call the radial velocity, that is really the velocity which is in that equation.
    Police cars measure your speed with radar.
    They reflect the radar off your car and they measure the change in frequency as the radar is reflected.
    That gives a Doppler shift because of your speed and that's the way they determine the speed of your car to a very high degree of accuracy.
    You can imagine that in astronomy Doppler shift plays a key role.
    Because we can measure the radial velocities of stars relative to us.
    Most stellar spectra show discrete frequencies, discrete wavelength, which result from atoms and molecules in the atmosphere of the stars.
    Last lecture I showed you with your own gratings a neon light source and I convinced you that there were discrete frequencies and discrete wavelengths emitted by the neon.
    If a particular discrete wavelength, for instance in our own laboratory, would be 5000 Angstrom, I look at the star, and I see that that wavelength is longer, lambda prime is larger than lambda, then I conclude -- lambda prime is larger than lambda, that means the wavelength the way I observe it is shifted towards longer wavelength, is shifted in the direction of the red, and we call that redshift.
    It means that we are receding from each other.
    If however I measure lambda prime to be smaller than lambda, so lambda prime smaller than lambda, we call that blueshift in astronomy, and it means that we are approaching each other.
    And so we make reference to the direction in the spectrum where the lines are moving.
    I can give you a simple example.
    I looked up for the star Delta Leporis what the redshift is.
    There is a line that most stars show in their spectrum which is due to calcium, it even has a particular name, I think it's called the calcium K line, but that's not so important, the name.
    In our own laboratory, lambda is known to a high degree of accuracy, is 3933.664 Angstroms.
    We look at the star and we recognize without a doubt that that's due to calcium in the atmosphere of the star and we find that lambda prime is 1.298 Angstroms higher than lambda.
    So lambda prime is larger than lambda.
    So there is redshift and so we are receding from each other.
    I go to that equation.
    I substitute lambda prime and lambda in there and I find that beta equals +3.3 times 10 to the -4.
    The + for beta indeed confirms that we are receding, that our relative velocity is away from each other, and I find therefore that the radial velocity -- I stress it is the radial component of our velocity is then beta times C and that turns out to be approximately 99 kilometers per second.
    So I have measured now the relative velocity, radial velocity, between the star and me, and the question whether the star is moving away from me or I move away from the star is an irrelevant question, it is always the relative velocity that matters.
    How can I measure the wavelength shifts so accurately that we can see the difference of 1.3 angstroms out of 4000?
    The way that it's done is that you observe the starlight and you make a spectrum and at the same time you make a spectrum of light sources in the laboratory with well-known and well-calibrated wavelength.
    Suppose there were some neon in the atmosphere of a star.
    Then you could compare the neon light the way we looked at it last lecture.
    You could compare it with the wavelength that you see from the star and you can see very, very small shifts.
    You make a relative measurement.
    So you need spectrometers with very high spectral resolution.
    So there was a big industry in the early twentieth century to measure these relative velocities of stars.
    And their speeds were typically 100, 200 kilometers per second.
    Not unlike the star that I just calculated for you.
    Some of those stars relative to us are approaching.
    Other stars are receding in our galaxy.
    But it was Slipher in the 1920s who observed the redshift of some nebulae which were believed at the time to be in our own galaxy and he found that they were -- had a very high velocity of up to 1500 kilometers per second, and they were always moving away from us.
    And it was found shortly after that that these nebulae were not in our own galaxy but that they were galaxies in their own right.
    So they were collections of about 10 billion stars just like our own galaxy.
    And so when you take a spectrum of those galaxies, then of course you get the average of millions and millions of stars, but that still would allow you then to calculate the redshift, the average red shift, of the galaxy, and therefore its velocity.
    And Hubble, the famous astronomer after which the Hubble space telescope is named, and Humason made a very courageous attempt to measure also the distance to these galaxies.
    They knew the velocities.
    That was easy because they knew the redshifts.
    The distance determinations in astronomy is a can of worms.
    And I will spare you the details about the distance determinations.
    But Hubble made a spectacular discovery.
    He found a linear relation between the velocity and the distances.
    And we know this as Hubble's law.
    And Hubble's law is that the velocity is a constant which is now named after Hubble, capital H, times D.
    And the modern value for H, the modern value for H is 72 kilometers per second per megaparsec.
    What is a megaparsec?
    A megaparsec is a distance.
    In astronomy we don't deal with inches, we don't deal with kilometers, that is just not big enough, we deal with parsecs and megaparsecs.
    And one megaparsec is 3.26 times 10 to the 6 light-years.
    And if you want that in kilometers, it's not unreasonable question, it's about 3.1 times 10 to the 19 kilometers.
    So I could calculate for a specific galaxy that I have in mind, I can calculate the distance if I know the red shift.
    I have a particular galaxy in mind for which lambda prime -- for which lambda prime is 1.0033 times lambda.
    So notice again that the wavelength that I receive is indeed longer than lambda, so there is a redshift.
    I go to my Doppler shift equation which is this one.
    I calculate beta.
    One equation with one unknown, can solve for beta.
    And I find now that V is 5000 kilometers per second.
    Very straightforward, nothing special, very easy calculation.
    But now with Hubble's law I can calculate what D is.
    Because D now is the velocity which is 5000 kilometers per second divided by that 72 and that then is approximately 69 megaparsec.
    Again we have the distance if we do it in these units in megaparsecs.
    That's about 225 million light-years.
    And so the object is about 225 million light-years away from us.
    So it took the light 225 million years to reach us.
    So when you see light from this object you're looking back in time.
    And if you have a galaxy which is twice as far away as this one, then the velocity would be twice as high.
    And they're always receding relative to us.
    I'd like to show you now some spectra of three galaxies.
    Can I have the first slide, John?
    All right, you see here a galaxy and here you see the spectrum of that galaxy.
    That may not be very impressive to you.
    The lines that are being recognized to be due to calcium K and calcium H are these two dark lines.
    Some of you may not even be able to see them.
    And this is the comparison spectra taken in the laboratory.
    These lines are seen as dark lines, not as bright lines.
    We call them absorption lines.
    They are formed in the atmosphere of the star.
    Why they show up as dark lines and not as bright lines is not important now.
    I don't want to go into that.
    That's too much astronomy.
    But they are lines and that's what counts.
    And these lines are shifted towards the red part of the spectrum by a teeny weeny little bit.
    You see here this little arrow.
    And the conclusion then is that in this case the velocity of that galaxy is t- 720 miles per second which translates into 1150 kilometers per second, and so that brings this object if you believe the modern value for Hubble constant at about 16 megaparsec.
    This galaxy is substantially farther away.
    No surprise that it therefore also looks smaller in size, and notice that here the lines have shifted.
    These lines have shifted substantially further.
    And if I did my homework, using the velocity that they claim, which they can do with high degree of accuracy because you can calculate lambda prime divided by lambda, those measurements can be made with enorm- accuracy, I find that this object is about 305 megaparsecs away from us, so that's about 20 times further away than this object.
    So the speed is also about 20 times higher of course because there's a linear relationship.
    And if you look at this one which is even further away, then notice that these lines have shifted even more.
    The next slide shows you what I would call Hubble diagram.
    It was kindly sent to me by Wendy Freedman and her coworkers.
    Wendy is the leader of a large team of scientists who are making observations with the Hubble space telescope.
    You see here distance and you see here velocity in the units that we used in class, kilometers per second.
    Forget this part.
    That's not so important.
    But you see the incredible linear relationship.

Pengembangan Perkuliahan
1. Buatlah sebuah Esai mengenai materi perkuliahan ini
2. Buatlah sebuah kelompok berjumlah 5 orang untuk menganalisis materi perkuliahan ini
3. Lakukan Penelitian Sederhana dengan kelompok tersebut
4. Hasilkan sebuah produk yang dapat digunakan oleh masyarakat
5. Kembangkan produk tersebut dengan senantiasa meningkatkan kualitasnya

Ucapan Terima Kasih Kepada:

1. Para Dosen MIT di Departemen Fisika

a. Prof. Walter Lewin, Ph.D.

b. Prof. Bernd Surrow, Ph.D.
(http://web.mit.edu/physics/people/faculty/surrow_bernd.html)


Staff

Visualizations:
Prof. John Belcher

Instructors:
Dr. Peter Dourmashkin
Prof. Bruce Knuteson
Prof. Gunther Roland
Prof. Bolek Wyslouch
Dr. Brian Wecht
Prof. Eric Katsavounidis
Prof. Robert Simcoe
Prof. Joseph Formaggio
Course Co-Administrators:
Dr. Peter Dourmashkin
Prof. Robert Redwine

Technical Instructors:
Andy Neely
Matthew Strafuss

Course Material:
Dr. Peter Dourmashkin
Prof. Eric Hudson
Dr. Sen-Ben Liao

Acknowledgements


2. Para Dosen Pendidikan Fisika, FPMIPA, Universitas Pendidikan Indonesia.

Terima Kasih Semoga Bermanfaat dan mohon Maaf apabila ada kesalahan.

Jumat, 01 Juli 2011

Fisika untuk Universitas

Fisika untuk Universitas

Ditujukan untuk meningkatkan kualitas proses dan hasil perkuliahan Fisika di tingkat Universitas


All physics of the 19th century and earlier is called classical physics.
 Examples are Newtonian mechanics, which we dealt with this whole term, and electricity and magnetism, which you will encounter the next term. In the early part of this century, when we learned about the composition of atoms, it became clear that classical physics did not work on the very small scale of the atoms. The size of an atom is only ten to the minus ten meters.
 If you take 250 million of them and you line them up, that's only one inch. In 1911, the English physicist Rutherford demonstrated that almost all the mass of an atom is concentrated in an extreme small volume at the center of the atom. 
We call that the nucleus, it's positively charged. And there are electrons which are negatively charged, which are in orbits around the nucleus, and the typical distances from the nucleus to the electrons is about 100,000 times larger than the size of the nucleus itself. 
As early as 1920, Rutherford named the proton, and Chadwick discovered the neutron in 1932, for which he received the Nobel Prize. Now, let us imagine that this lecture hall is an atom. 
And the size of an atom is defined by the orbits, the outer orbits of the electrons. If I scale it properly, now, in this ratio 100,000 to 1, then the size of the nucleus would be even smaller than a grain of sand.
 And it just so happens that yesterday I went to Plum Island, I walked for three hours on the beach and I ended up with some sand in my pockets. And so I will donate to you one proton; make sure you hold onto it... Ooh, this is two protons, that's too generous. So keep it there this is one proton. 
And there would be an electron, then, anywhere there, near the walls, going around like mad in orbit and that would then be a hydrogen atom. Just think about what an atom is. 
 An atom is all vacuum. You and I are all vacuum. You think of yourself as being something, but we are nothing. You can ask yourself the question, If you are all vacuum, why is it, then, that I can move my hand not through the other hand, like a ghost can walk through a wall? That's not so easy to answer, and in fact, you cannot answer it with classical physics and I will not return to that today.
 But you are all vacuum. According to Maxwell's equations, Maxwell's law of electricity and magnetism, an electron, because of the attractive force of the proton, would spiral into the proton in a minute fraction of a second, and so atoms could not exist. Now, we know that's not true. 
We know that atoms do exist. And so that created a problem for physics and it was the Danish physicist Niels Bohr who in 1913 postulated that electrons move around the nucleus in well-defined orbits which are distinctly separated from each other, and that the spiraling-in of the electrons into the nucleus does not occur, for the reason that an electron cannot exist in between these allowed orbits. It can jump from one orbit to another, but it cannot exist in between. 
Now, Bohr's suggestion was earth-shaking, because it would also imply that a planet that goes around the sun cannot orbit the sun just at any distance. You couldn't move it just a trifle in or a trifle farther out. It would also require discrete orbits. 
It would also mean that if you had a tennis ball and you would bounce the tennis ball up and down, that the tennis ball could not reach just any level above the ground, but it would only be discrete levels, and that is very much against our intuition. We'd like to think that when you bounce a tennis ball, that it can reach any level that you want to. You give it just a little bit more energy and it will go a little higher. That, according to quantum mechanics, would not be possible. 
Now, all this seems rather bizarre, as it goes against our daily experiences, but before we dismiss the idea of quantization see, the quantization comes in when you talk about discrete orbits-- you have to realize that the differences in the allowed heights of the tennis ball and the differences between the allowed orbits of the planets around the sun would be so infinitesimally small that we may never be able to measure it. 
 In other words, quantum mechanics really plays no role in our macroscopic world. Now, atoms are very, very small compared to tennis balls, and the quantization effects are much larger in the sub-microscopic world of electrons and atoms than in our familiar world of baseballs, pots and pans, and planets. So before we continue, I would like to repeat to you one of the cornerstones of quantum mechanics. And it says that the electrons in atoms can only exist at well-defined energy levels think of them as being orbits around the nucleus, and they cannot exist in between. 
Now, when I heat a substance, the electrons in the atoms can jump from inner orbits to allowed outer orbits, and when they do so, they can leave a hole, an opening, an empty space in the inner orbits. But later on, they can fall back to fill that opening. They can occupy that place again.
 And when I keep heating this substance, there is some kind of a musical chair game going on. The electrons will go to outer orbits, they may spend there some time and then they may fall to lower orbits, to inner orbits. You see here a vase, a very precious vase, and when I pick up this vase, I have to do work. I bring it further away from the center of the Earth.
 Now, is that energy lost? No. I could drop the vase, and it would pick up kinetic energy. I will get that energy back. Gravitational potential energy will be converted to kinetic energy. It will crash to pieces, and it will generate some heat.
 In fact, the breaking itself of this vase would take some energy. In a similar way, the energy that you put into electrons when you bring them to outer orbits is retrieved when the electrons fall back. 
So there is a parallel-- dropping this vase and getting your work back that I put in. It wouldn't be a nice thing to do to this 500-year-old vase, but as far as I'm concerned, perfectly reasonable to do it with Ohanian, so we can let that go, and the energy will come out in the form of heat and also in the form of, perhaps, some noise. 
When electrons fall from an outer orbit back to an inner orbit, it's not kinetic energy that is released, but it comes out often in the form of light, electromagnetic radiation. Light has energy.


Pengembangan Perkuliahan 

1. Buatlah sebuah Esai mengenai materi perkuliahan ini 
2. Buatlah sebuah kelompok berjumlah 5 orang untuk menganalisis materi perkuliahan ini
3. Lakukan Penelitian Sederhana dengan kelompok tersebut 
4. Hasilkan sebuah produk yang dapat digunakan oleh masyarakat 
5. Kembangkan produk tersebut dengan senantiasa meningkatkan kualitasnya  

Ucapan Terima Kasih:


1. Para Dosen MIT di Departemen Fisika

a. Prof. Walter Lewin, Ph.D.

b. Prof. Bernd Surrow, Ph.D.

2. Para Dosen Pendidikan Fisika, FPMIPA, Universitas Pendidikan Indonesia.

Terima Kasih Semoga Bermanfaat dan mohon Maaf apabila ada kesalahan.

Fisika untuk Universitas

Fisika untuk Universitas

Ditujukan untuk meningkatkan kualitas proses dan hasil perkuliahan Fisika di tingkat Universitas

Kelistrikan dan Kemagnetan


Topics covered:

Gratings
Resolving Power
Single-Slit Diffraction
Angular Resolution
Human Eye
Telescopes

Instructor/speaker: Prof. Walter Lewin

Free Downloads

Video

  • iTunes U (MP4 - 107MB)
  • Internet Archive (MP4 - 211MB)

    » Download this transcript (PDF)

    So last time we discussed the interference patterns due to two coherent light sources.

    Today I will expand on this by exploring many, many light sources.

    Suppose instead of having two slits through which I allow the light to go I have many.

    I have N, capital N.

    And let the separation between two adjacent ones be D, and so plane parallel waves come in and each one of these light sources is going to be a Huygens source, is going to produce spherical waves.

    And so now we can ask ourselves the same question that we did before, and that is look at a long distance far away at certain angle theta.

    Where will we see maxima and where will we see minima?

    And then we can put up here a screen at a distance L and we will call this X equals 0, and then we can even ask the question where exactly on that screen will we see these maxima?

    You will have constructive interference, exactly the same situation that we had with the double-slit interference pattern, when the sine of theta of N equals N lambda divided by D.

    And if you're dealing with very small angle theta, you should all remember that the sine of an angle is the same as the angle itself, provided that you work in radians.

    So for small angles, you can always use this approximation, if you remember that it is in radians.

    And that's only in the small angle approximation.

    And so the conclusion then is if we work in radians for now that theta of N for the maxima is then at N lambda divided by D, N being 0 right here, N being 1 right here, N being 2 right there.

    And if you want to express that in terms of a linear displacement from 0, then X of N again for small angles is L times that number.

    And so now you get displacement here in terms of centimeters or in terms of millimeters.

    So you will say well big deal, it's the same result that we had for the double-slit interferometer.

    We had exactly the same equation.

    There was no difference.

    And D now is the separation between two sources here.

    It is obvious that it is the same because if these two are constructively interfering then these two will too and these two will too and these two will too so all of them will, so it's not too surprising that you get exactly the same result.

    But now comes the big surprise.

    We haven't discussed yet the issue where the locations are where light plus light gives darkness.

    We haven't discussed the destructive interference.

    And to derive that properly is very tricky.

    In fact if you take 8.03 you will see a perfect derivation.

    But I will give you the results.

    What is not so intuitive, that if you have N sources, that between two major maxima, that means between this maximum at N equals 0 and a maximum at N equals 1, there are now N, capital N, minus 1 minima.

    And minima means complete destructive interference.

    So if capital N is 2, which we did last time, 2-1=1, exactly, that was correct.

    We had only one zero in between the two maxima.

    But that's not the case anymore when capital N is much larger than 2.

    And so let me now make you a -- a sketch whereby I plot the intensity of the light as a function of angle theta and this is the intensity, so that's in watts per square meter, remember that's the Poynting vector, and let this be 0, and let the angle theta 1 be here, and for small angles then that's lambda divided by D, and here you have theta 2, which is 2 lambda divided by D, and so on.

    I take the small angle approximation.

    So this angle is now in radians.

    What you're going to see now is the following intensity, as a function of theta.

    You see here a peak, and you're going to see here a peak, and you're going to see here one, and so on, and the same of course is true on the other side.

    And here in between you're going to see now N-1 locations whereby you have total destructive interference.

    And the same is the case here.

    And this can be huge.

    N can be a few hundred.

    So we have many many locations where you have 100% destructive interference.

    Now this point, this first location, where we hit the zero, that now is at the position lambda divided by D divided by capital N.

    And I will call that angle from the maximum to that zero, from this maximum to this zero, I will call that angle for now delta theta.

    Because that delta theta is a measure for the width of the line, here is at maximum, here it is zero, and so that angle delta theta in terms of radians is lambda divided by D times N, which then is approximately theta 1 divided by N, because theta 1 itself is lambda divided by D.

    And so you see that it is N times smaller than this distance.

    And so if N is large, these lines become extremely narrow, and that's the big difference between two-slit interference and multiple-slit interference.

    And the larger N is, the higher these peaks will be.

    The height of these peaks, the intensity here, is proportional to N squared.

    And you may say, "gee, why -- why not -- is why is it not linearly proportional to N?" Well that's easy to see.

    Suppose I increase capital N, the number of sources, by a factor of three.

    Then the electric field vector where there are maxima is three times larger.

    But if the electric field vector is three times larger the Poynting vector is nine times larger.

    So you get nine times more light.

    Now you may say, "gee, that's a violation of the conservation of energy.

    Three times more sources, nine times more light, how can that be?" Well, you overlook then that if you make N go up by a factor of three that the lines get narrower by a factor of three, because of this N here, and so they get higher by a factor of nine, and they get narrower by a factor of three, and so you gain a factor of three in light.

    Of course you gain a factor of three.

    You have three times more sources.

    You get three times more light.

    So you see there's no violation of the conservation of energy here.

    And I want to demonstrate this to you using a -- a red laser which we have used before.

    And I will use what we call a grating, a grating is a plate which is specially prepared, a transparent plate, which has grooves in it, and the one that I will use has tw- 2500 grooves, we call them lines, per inch.

    That means the separation D between two adjacent grooves in my case is about 2.16 microns.

    A micron is 10 to the -6 meters.

    And the wavelength that I'm going to use is our red laser, which is about 6.3 times 10 to the -7 meters.

    And I'm going to put the whole thing there.

    I'm going to make you see it there at a distance L.

    Which is about 10 meters.

    And so this allows me now to calculate where the zero order will fall, where the first order and where the second order will fall.

    We call when N is 0, we call that zero order, so this is zero order, when N is 1 we call that first order, and when N is 2 we call that second order.

    And you have of course the first order also on this side and the second order also on this side.

    Everything that you have here you have to also think of it as being on the other side.

    So I can predict now where the zero order will be when N is 0.

    That is 0 degrees.

    That's immediately obvious.

    I use that equation.

    If N is 0 the zero order is always right at the center, provided that all these sources are in phase.

    And they will be in phase because I use plane waves.

    So Huygens will tell you that they're going to oscillate exactly at the same time, they produce the same frequency, they produce the same wavelength, and they're all in phase with each other.

    So there will be a maximum at theta 1 equals 0.

    And then there will be a maximum which I calculated to be at 3.55 degrees.

    I calculated that from this equation and then theta 2 will be at roughly 7.1 degrees.

    If you want to know how wide the width of this peak is going to be, then you have to know how many lines of my grating I will be using.

    Well, my grating is like so.

    Here I have these lines not unlike the grating that you have in your optics kit.

    There are 2500 of those lines per inch.

    And my laser beam is roughly 2 millimeters in size.

    So this is about 2 millimeters.

    And that tells me then that I cover about 200 lines.

    And if I have 200 lines I can now calculate how wide that line is going to be.

    Because this factor of N enters into it here.

    And if I express that in terms of that angle delta theta, then the angle delta theta, going back here, so delta theta is then the 3.55 degrees divided by 200, and that's an extremely small angle, that angle is approximately one arc minute, which is 60 times smaller than one degree.

    And if you want to translate that in terms of how wide that spot will be, if I see it on the screen 10 meters away from me, and if you want to call that delta X, then you would naively predict that delta X is something like 3 millimeters, and the reason why I say naively because you will not see that it is 3 millimeters, it will be extremely narrow, but it will be more than 3 millimeters, because the limiting factor is always the divergence of my laser beam.

    And so the divergence of my laser beam is more than one arc minute, and so I don't get down to the one arc minute narrow beam.

    I'm not too far away from it, though.

    So this is what I want to show you first.

    I will turn on the laser first, and then make it very dark because we do need darkness -- or this has to come off because that would obviously -- oh, I turned off the wrong laser, but that -- I turned on the wrong laser, but that's OK.


Pengembangan Perkuliahan

1. Buatlah sebuah Esai mengenai materi perkuliahan ini

2. Buatlah sebuah kelompok berjumlah 5 orang untuk menganalisis materi perkuliahan ini

3. Lakukan Penelitian Sederhana dengan kelompok tersebut

4. Hasilkan sebuah produk yang dapat digunakan oleh masyarakat

5. Kembangkan produk tersebut dengan senantiasa meningkatkan kualitasnya

Ucapan Terima Kasih Kepada:

1. Para Dosen MIT di Departemen Fisika

a. Prof. Walter Lewin, Ph.D.

b. Prof. Bernd Surrow, Ph.D.
(http://web.mit.edu/physics/people/faculty/surrow_bernd.html)

Staff

Visualizations:
Prof. John Belcher

Instructors:
Dr. Peter Dourmashkin
Prof. Bruce Knuteson
Prof. Gunther Roland
Prof. Bolek Wyslouch
Dr. Brian Wecht
Prof. Eric Katsavounidis
Prof. Robert Simcoe
Prof. Joseph Formaggio

Course Co-Administrators:
Dr. Peter Dourmashkin
Prof. Robert Redwine

Technical Instructors:
Andy Neely
Matthew Strafuss

Course Material:
Dr. Peter Dourmashkin
Prof. Eric Hudson
Dr. Sen-Ben Liao

Acknowledgements

The TEAL project is supported by The Alex and Brit d'Arbeloff Fund for Excellence in MIT Education, MIT iCampus, the Davis Educational Foundation, the National Science Foundation, the Class of 1960 Endowment for Innovation in Education, the Class of 1951 Fund for Excellence in Education, the Class of 1955 Fund for Excellence in Teaching, and the Helena Foundation. Many people have contributed to the development of the course materials. (PDF)


2. Para Dosen Pendidikan Fisika, FPMIPA, Universitas Pendidikan Indonesia.

Terima Kasih Semoga Bermanfaat dan mohon Maaf apabila ada kesalahan.